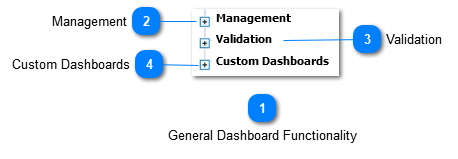
Certain Controls are interactive and allows exporting, filtering, "Drill Down" and "Drill Up" where applicable as well changing the layout of the control.
Icons:
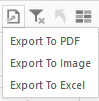
Export Icon
Left Clicking this Icon will bring up
Which allows the control's information to be exported to PDF, Image or Excel.
Left Clicking on any of the abovementioned Sub-Icons will cause a download to start in your browser.
Master Filter
The Master Filter Icon will become a dark solid color when filtering has occurred.
Filtering occurs when the User Left-Clicks on an applicable Control to Filter the information.
Eg:
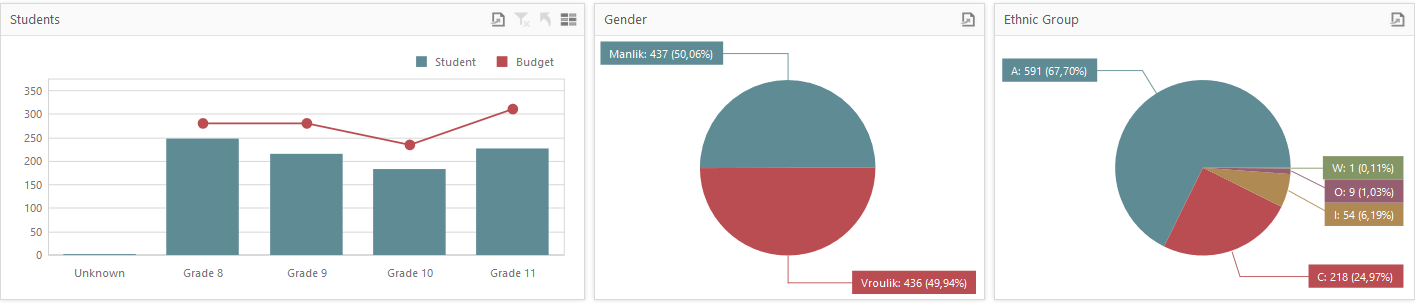
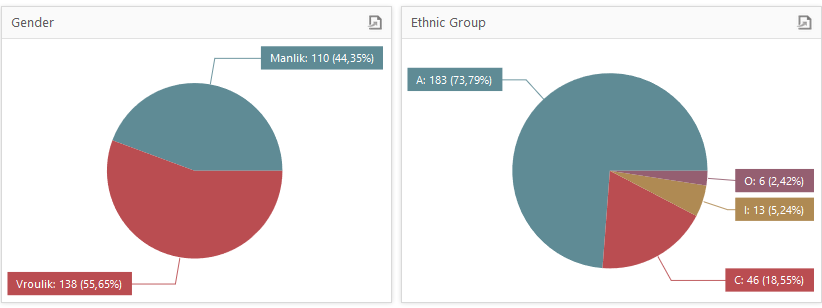
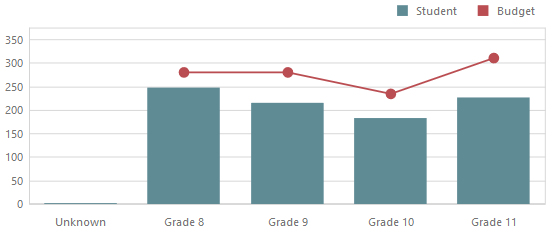
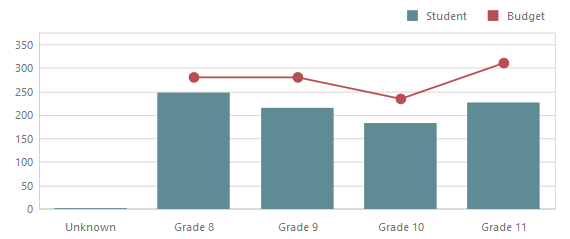
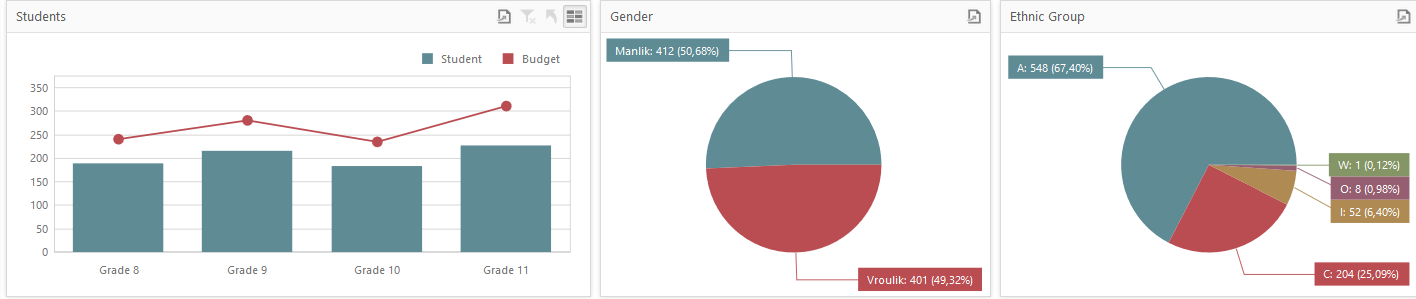
The above image shows Students, Gender and Ethnic Group.
The Students are the Student Counts per each Grade as bars, with the Summed Class Budgets per Grade indicated by the Red Line.
The Gender Pie Graph indicates for the entire school, the amounts per Gender.
The Ethnic Group Pie Graph indicates for the entire school, the amounts per Ethnic Group.
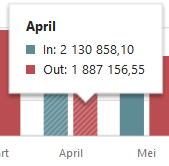
If the User Hovers the Mouse Pointer Over a bar - additional information will pop-up.
Eg:
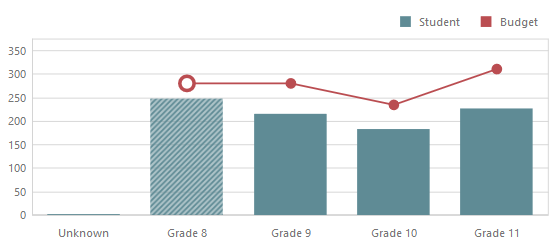
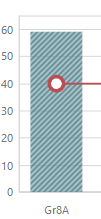
If the User were to Left-Click once on the Grade 8 bar within the Student's Control, the Grade 8 Bar will be filled with a striped pattern instead of the Solid Blue colour.
Eg:
Once the User has Left-Clicked once once the bar within the graph, the other controls will become filtered for the relevant selection.
For Grade 8 the user can now see the Gender Pie Chart as well the Ethnic Group Pie Chart have changed, displaying values for only the accumulated Grade 8 Learners.
The User will also note that the Master Filter Icon has changed from to
If the User left Clicks on the - the Pie Graphs and additional controls will revert back to displaying the entire School and not just the selected Grade.
Drill Up Icon
"Drill Up" and "Drill Down".
For this example, consider that a school's students are grouped:
1) Into Grades and then
b) Each Grade is Grouped into Classes
When we "Drill Down", we start from a collection of Information, which is grouped, and inspecting each group seperately.
"Drill Up" is the opposite. Eg. School:
Drill Down by Left-Clicking Once on Grade 8 - refer to the previous icon's example for more information (Master Filter)
Left-Clicking AGAIN on Grade 8 will "Drill Down" to show the Classes (next grouping) of the Grade 8 Group
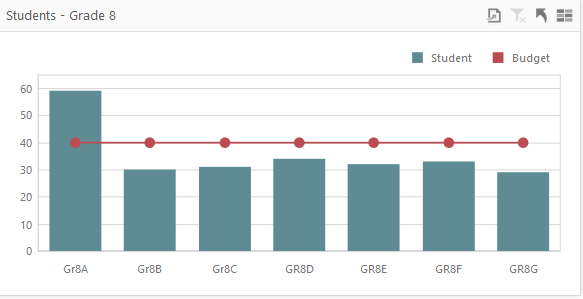
The Students Bar Graph will now Show "Students - Grade 8" instead of "Students".
Will now be available to "Left-Click" - which will revert the Bar-Graph back to showing the Grades of the School and not the Classes of the Selected Grade.
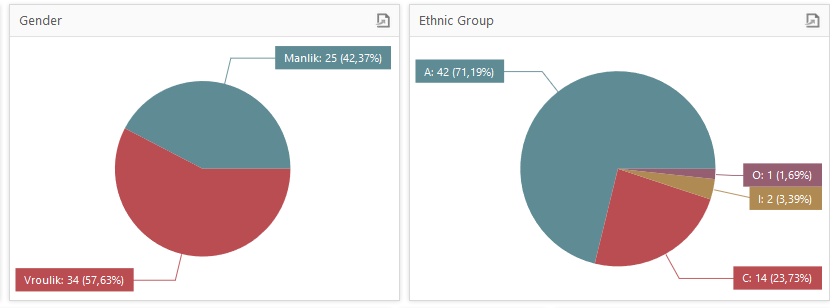
The Pie Charts will not have changed - they are still relevant to the Grade 8 grade which was selected - until a user Left-Clicks on a specific "Class" eg. Gr8A.
The Pie Charts will then alter to only be relevant to the selected Class as shown below.
Left-Clicking on a Class eg: Gr8A - will alter the Pie Charts and other controls to be filtered only for the Students in the Gr8A Class.
Multi-Select
The user may Left-Click on the Multi-Select Icon. Once Left-Clicked the Icon will change from to (a slight indented border will appear).
This will allow the user to Left-Click on Multiple sets of information. Eg:
With Multi-Select active, the User can Left-Click once on Grade 8 and then again once on Grade 9.
This will cause the filter to consider both Grade 8 and Grade 9 Students, and the Pie Charts and other relevant controls will be filtered accordingly.
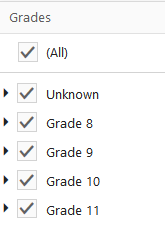
Check Box
By Left-Clicking inside a Check Box, the box will alter between active and inactive .
In this example, The Grades on the left can be selected for consideration or de-selected.
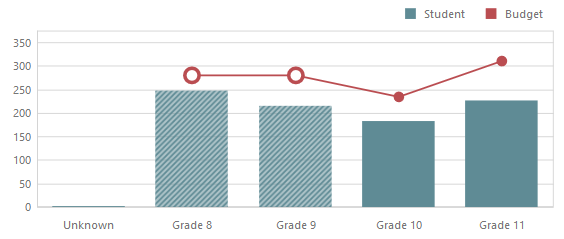
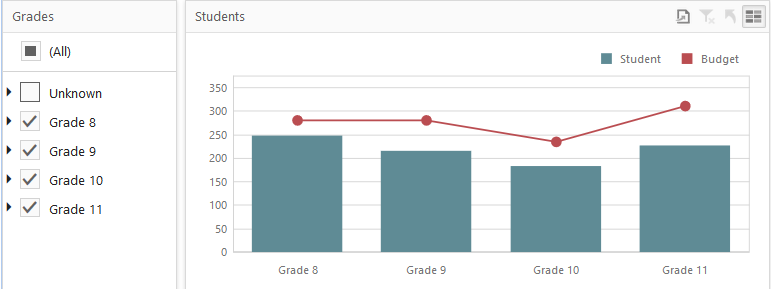
If we were to De-Select the "Unknown" Grade. The remaining controls will be filtered accordingly.
Note: This filtering is not the same as the Master Filter icon explained above.
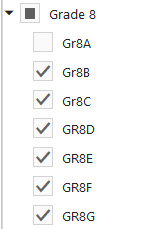
The user may as well - "Drill Down" by Left-Clicking the Icon - which will expand all subgroups (Classes) for the Grade 8 Group.
Eg:
Drill Down the Grade 8 Selection to display the available Classes, and the Gr8A class has been de-selected.
The remaining controls will now be filtered to show all Students except those in the "Unknown Grade" and those in the "Gr8A" class.
Note: Some Dashboards eg. Absenteeism have multiple pages.
Left-Clicking on either School or Student will alter the displayed information with respect to the page selected.
Eg. School Absenteeism will provide an overview of Absenteeism Counts for the School, grouped into Grades and subsequently into Classes.
Student Absenteeism will allow the user to select Per Student and then per type and date metrics.